Debugging Extensions
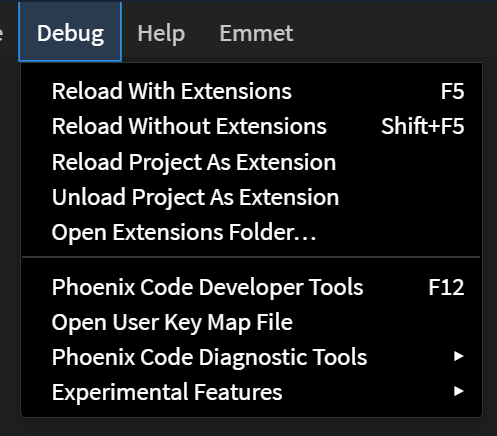
The Debug menu provides several options for extension development.

Phoenix Code Developer Tools
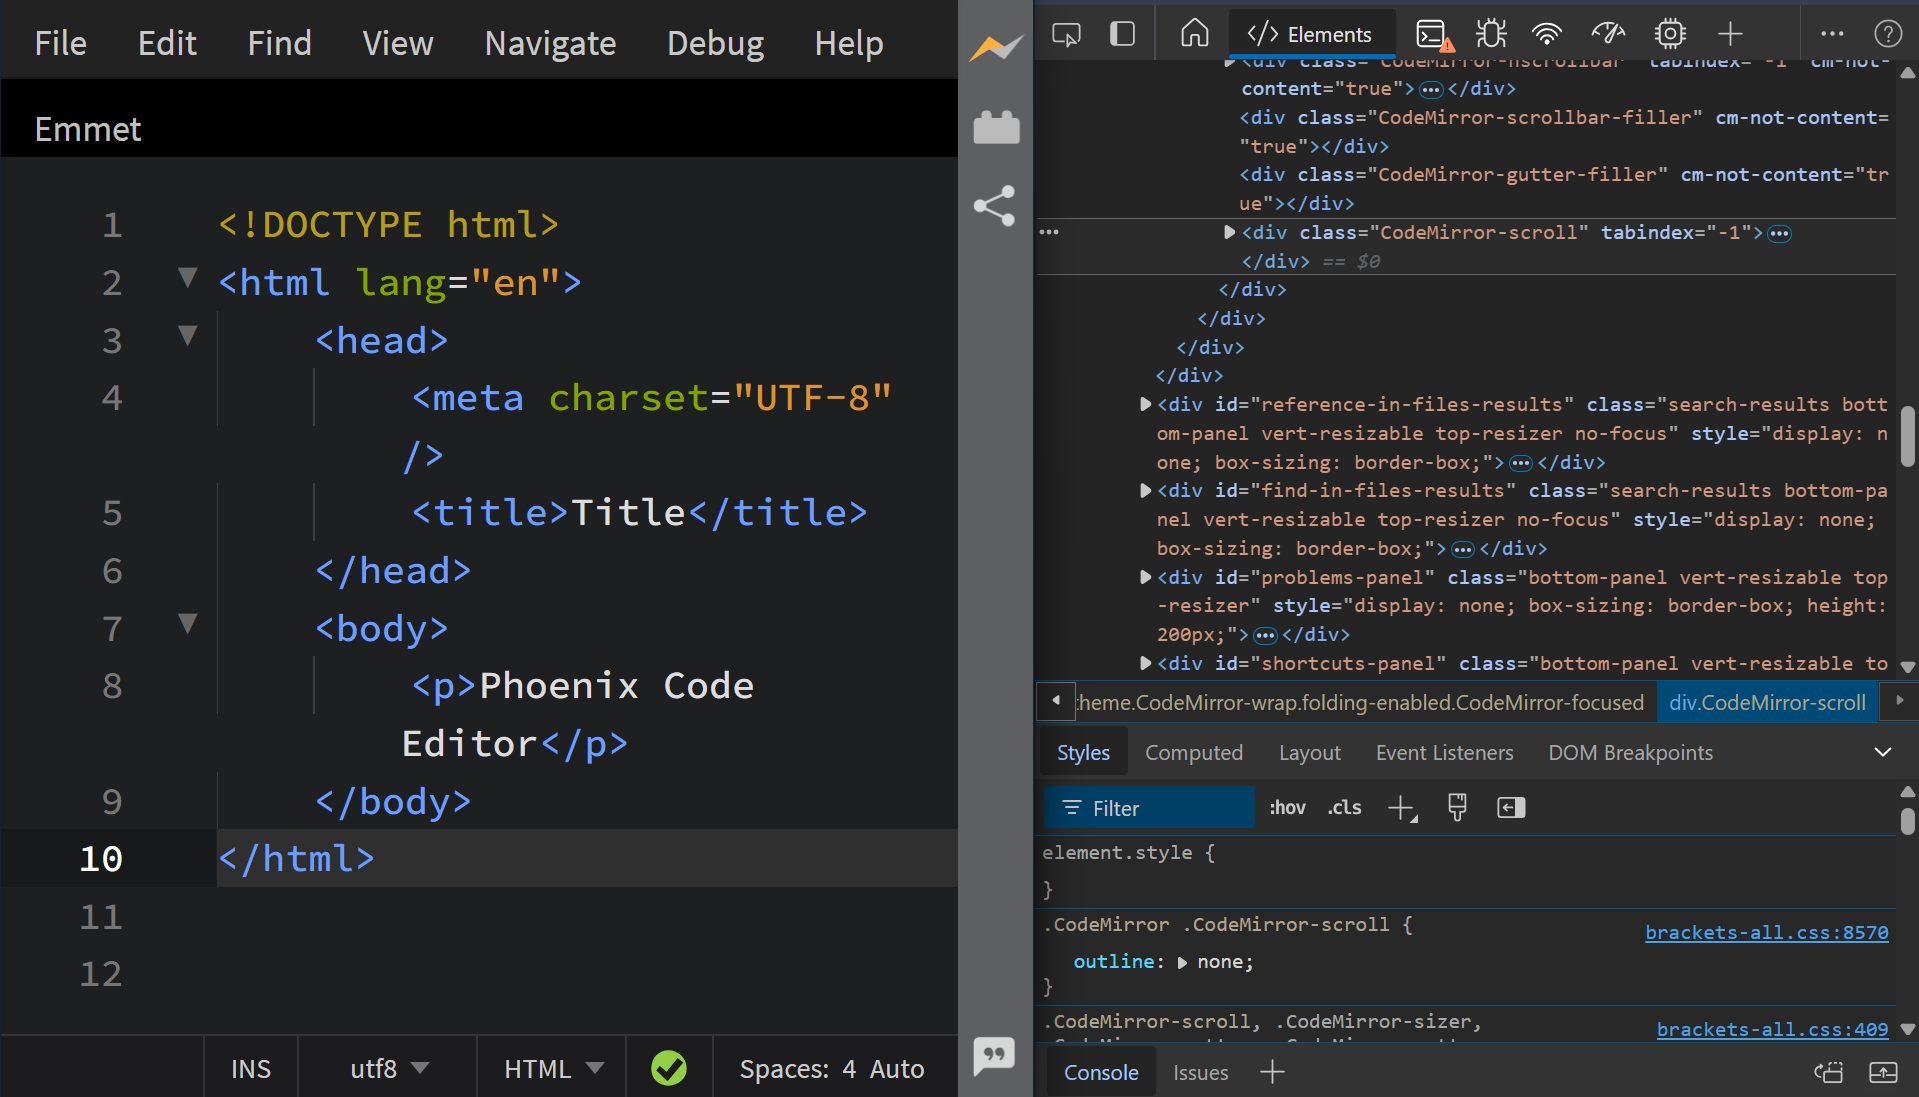
The Phoenix Code Developer Tools option (shortcut: F12) opens up the DevTools. Use this to inspect the DOM, preview logs and debug scripts.

Phoenix Code Diagnostic Tools
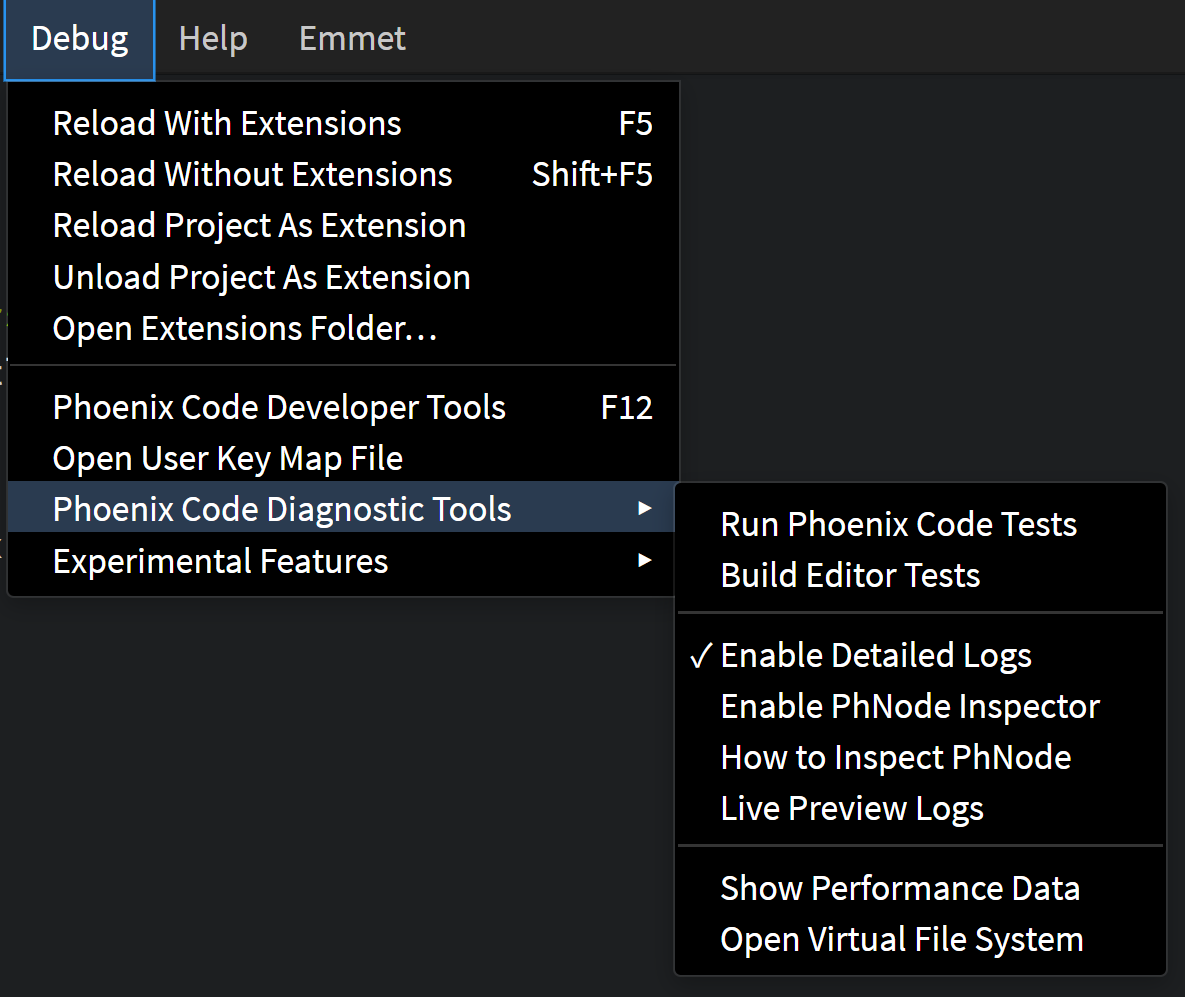
To open Phoenix Code Diagnostic tools, click on the Debug menu on the menu bar and navigate to the Phoenix Code Diagnostic Tools option. This section provides several tools for debugging purposes.

Available Diagnostic Tools
-
Run Phoenix Code TestsExecutes built-in tests to verify the functionality of Phoenix Code. -
Build Editor TestsBuilds and runs tests specifically for the editor environment. -
Enable Detailed LogsActivates verbose logging for better insight into extension behavior. Use this to identify errors or unexpected behaviors during development. -
Enable PhNode InspectorLaunches the PhNode inspector, allowing in-depth inspection of the extension runtime environment. -
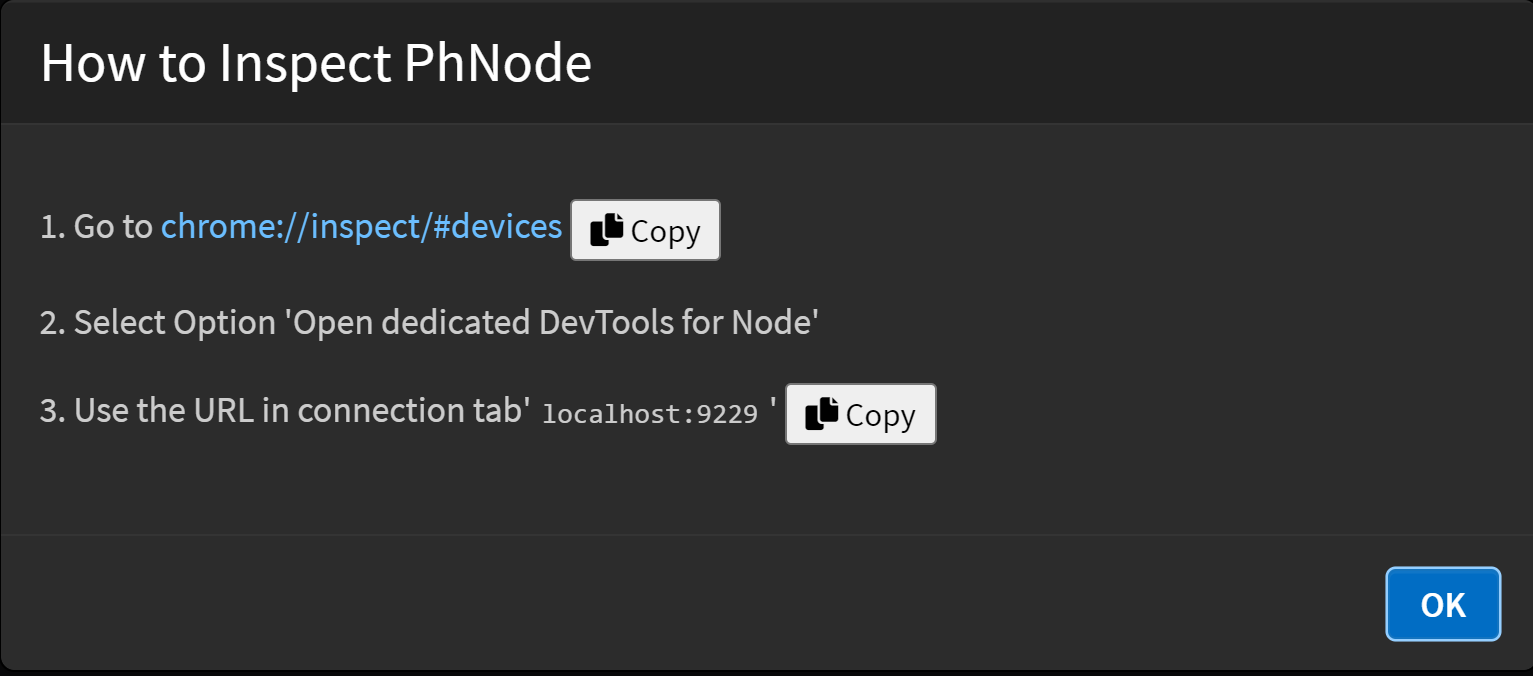
How to Inspect PhNodeProvides a guide to effectively use the PhNode Inspector.
-
Live Preview LogsDisplays real-time logs for active live previews, helping debug changes dynamically. -
Show Performance DataGenerates performance metrics to identify bottlenecks or performance issues within the extension. -
Open Virtual File SystemOpens and inspects the virtual file system used by Phoenix Code.
FAQs
Q. Why is console.log not displaying?
- By default, console logs are disabled. To enable them, click on Enable Detailed Logs under Phoenix Code Diagnostic Tools.